3 What a control actually does
Comparing like with like, one band at a time
3.1 Is the control even relevant?
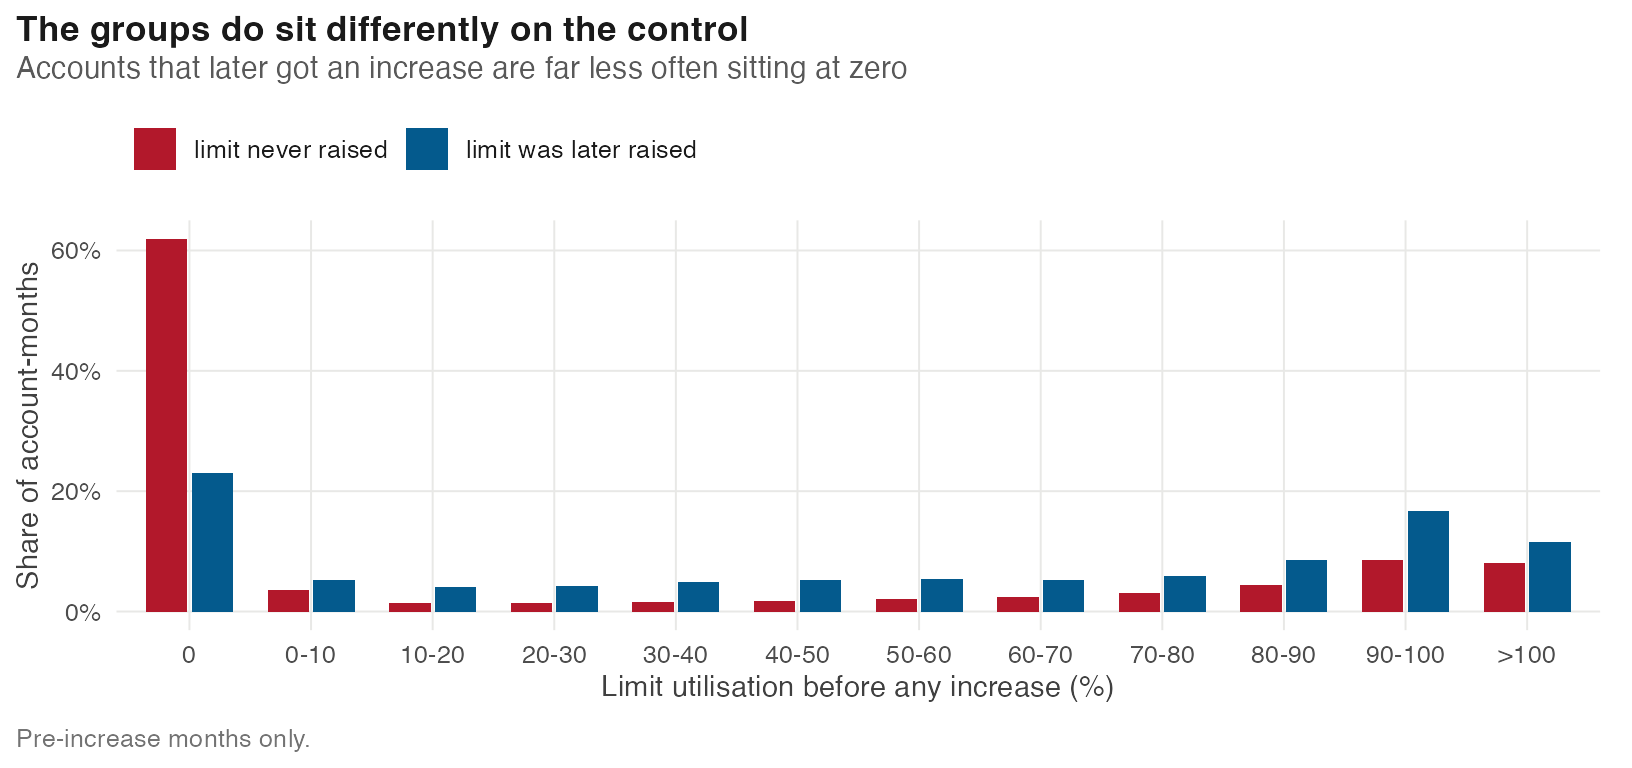
A control can only do work if the groups actually differ on it. Utilisation — the share of the granted limit an account is using — is the one behavioural variable measured every month.
It has an awkward shape: 58.6% of account-months sit at exactly zero, a customer holding a card and not using it. A density curve would hide that under a spike, so this is a plain count.
So this is not a hopeless control. Both groups appear across the whole range, which means the comparison rests on data rather than extrapolation, and they differ enough for an adjustment to move something.
3.2 What controlling actually does
Adding + utilization to a regression means: compare treated and untreated accounts that sit at the same utilisation, then average those comparisons. So look at them.
acc <- d[post == 0L, .(util = mean(utilization, na.rm = TRUE), dpd = mean(dpd30),
                       months = .N, treated = treated[1]), by = SK_ID_PREV][months >= 3]
acc[, bin := cut(util, c(-0.001, 0.001, seq(0.1, 1.0, 0.1), 2))]

gaps <- dcast(acc[, .(dpd = 100 * mean(dpd), x = mean(util), n = .N), by = .(treated, bin)],
              bin ~ treated, value.var = c("dpd", "x", "n"))
setnames(gaps, c("bin", "dpd_ctrl", "dpd_trt", "x_ctrl", "x_trt", "n_ctrl", "n_trt"))
gaps <- gaps[n_trt >= 50 & n_ctrl >= 50]
# Position each bubble at the utilisation actually observed in its bin, not at
# the bin's lower edge — two bins would otherwise collide near zero.
gaps[, `:=`(gap = dpd_trt - dpd_ctrl,
            x   = (x_ctrl * n_ctrl + x_trt * n_trt) / (n_ctrl + n_trt))]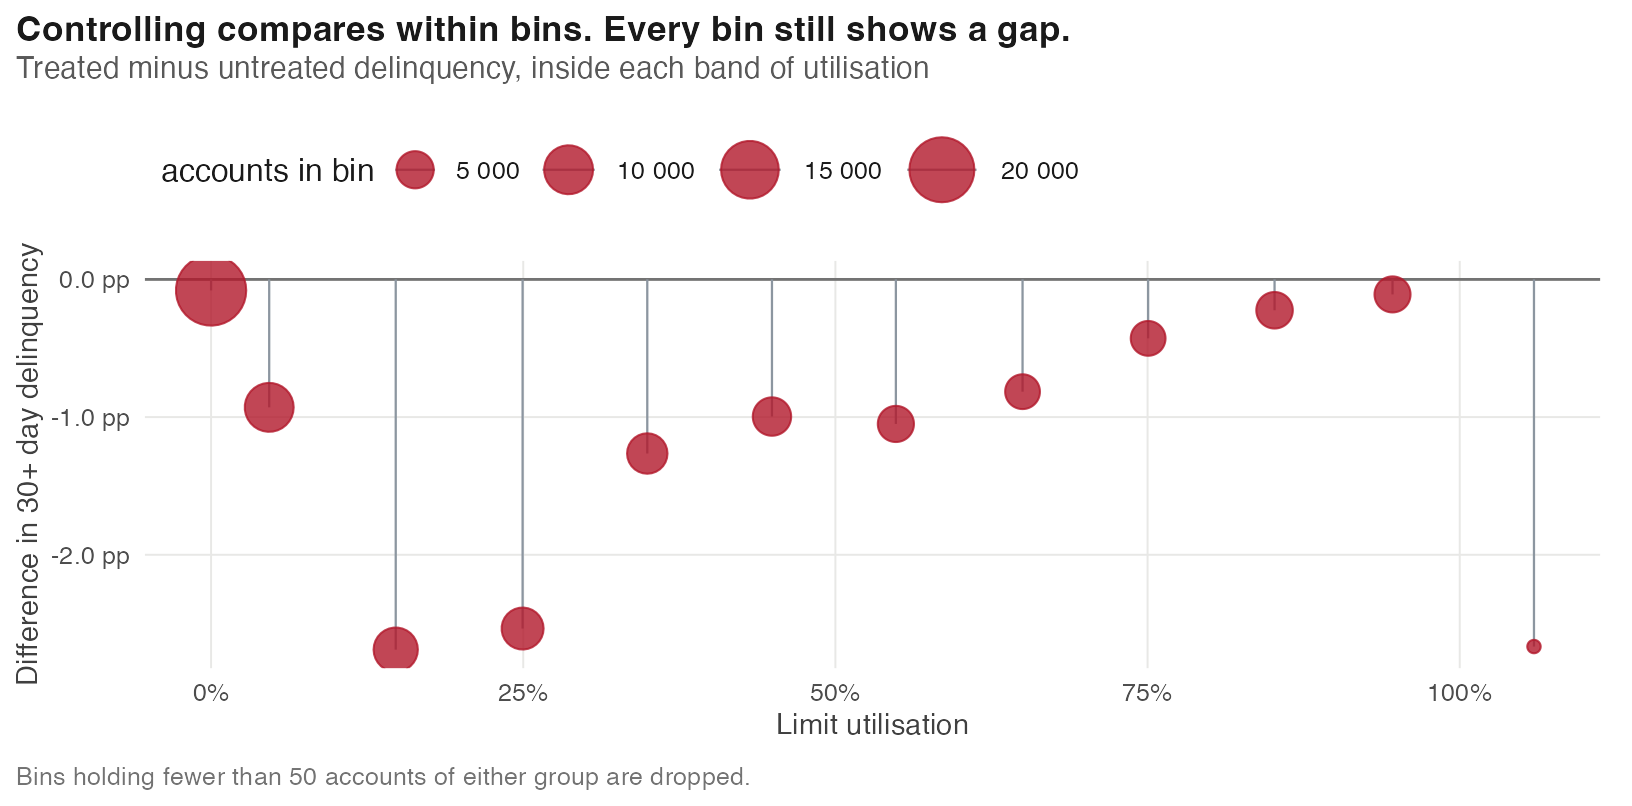
Every point is below zero. The adjustment reweights these comparisons; it cannot change the fact that each one already carries the gap.
So far, one control. What if we try harder?
Where this chapter’s code lives
Everything above runs from 03-what-a-control-does.qmd. Shared setup R/_common.R. The panel itself is built by R/01-build.R.