d[, util_bin := cut(utilization, br)]
d[, acc_bin  := cut(util_acc, br)]

specs <- list(
  "no controls"                  = dpd30 ~ raised,
  "+ utilisation"                = dpd30 ~ raised + utilization,
  "+ utilisation in 12 bands"    = dpd30 ~ raised + util_bin,
  "+ account average, banded"    = dpd30 ~ raised + util_bin + acc_bin,
  "+ calendar month dummies"     = dpd30 ~ raised + util_bin + acc_bin + month_f)

ladder <- rbindlist(lapply(names(specs), function(nm) {
  m <- feols(specs[[nm]], data = d, cluster = ~SK_ID_PREV)
  data.table(spec = nm, est = est(m), se = sef(m))
}))4 Trying harder does not rescue it
Five specifications, and no rule for when to stop
One control is a weak test. Give the control a flexible shape — twelve bands rather than a straight line — then add the account’s average utilisation, then a dummy for every calendar month, and watch what the estimate does.
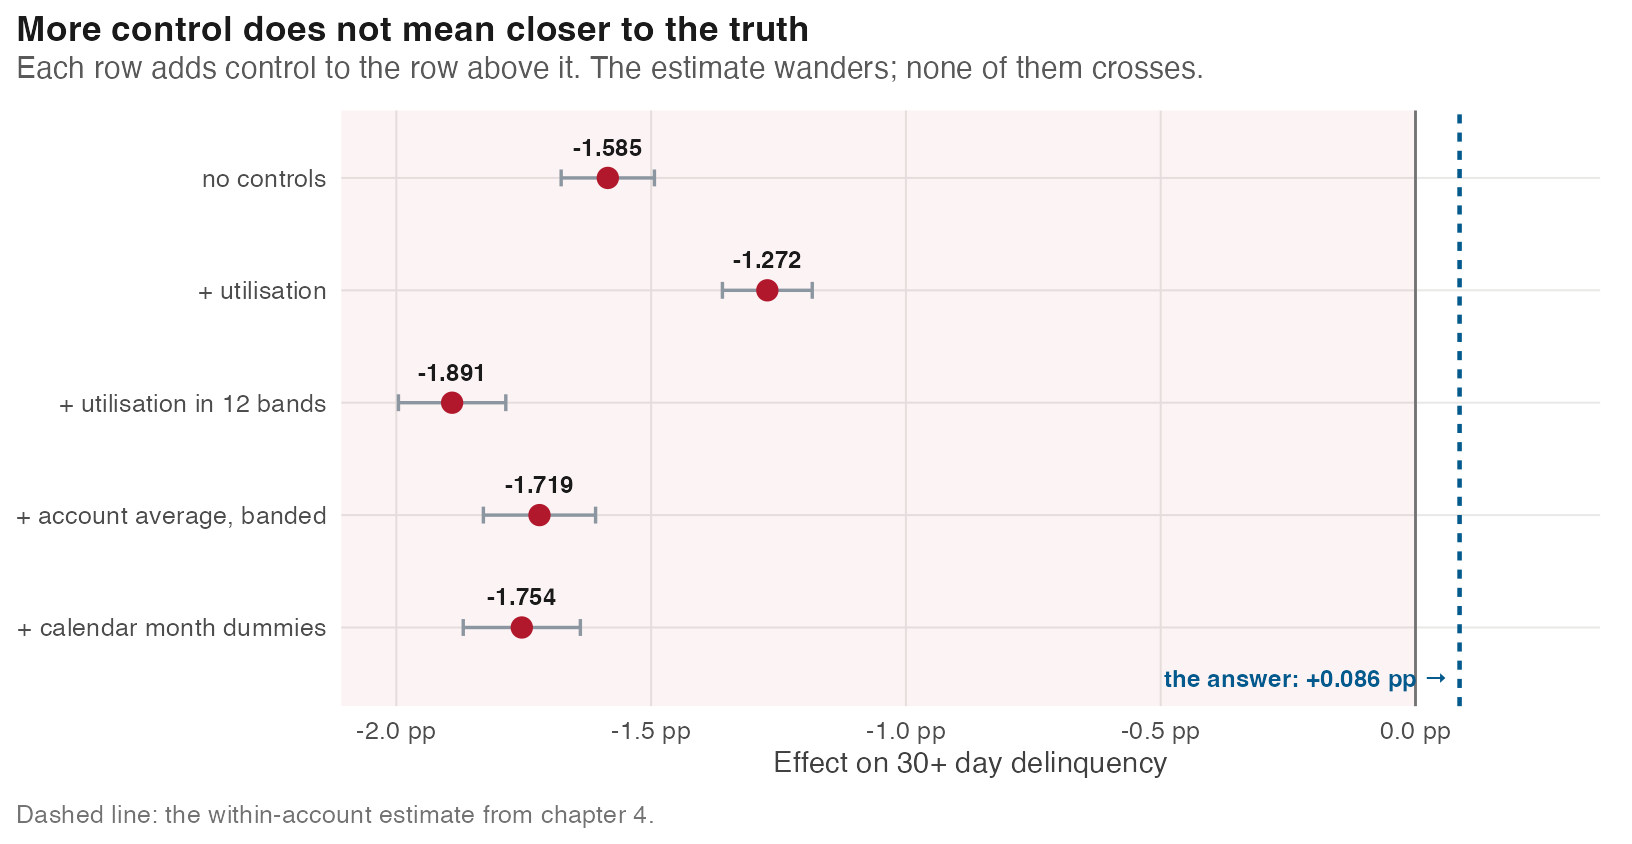
Watch what the estimate does rather than where it ends up. The single linear control pulls it to -1.272 pp — closer to the truth. Letting that same control bend into twelve bands pushes it back out to -1.891 pp, further from the answer than having no control at all. The last two rows land at -1.719 and -1.754 pp.
The estimate moves every time. It does not move in a direction. And every row reports a t-statistic past 28.
4.1 Why it stops
A control removes the part of the difference that runs through the variable you measured. It cannot touch the part that runs through anything else.
The lender did not decide who gets an increase by looking at utilisation. It used an internal assessment — repayment history, an application score, whatever else sits in its systems. None of that is in this dataset. There is no column for it, so no + variable can subtract it.
The confounder here is not a missing column, it is an unmeasured judgement
Controlling for observables answers: among accounts that look alike on the things I wrote down, what is the difference? If the lender’s decision rested on something you never wrote down, accounts that look alike to you were still sorted by the lender on something else.
Notice what the chart above does not give you: any signal about which row to believe. Each one moves the number, none announces itself as the right one, and the sequence does not converge on anything. Adding a control to a model with an unobserved confounder has no guaranteed direction — it can close part of the bias or open more of it, and from inside the regression output the two look identical.
This is the part worth carrying away. The instinct that a model with more controls is a better model has nothing behind it here.
The way out is not a better control. It is a comparison that does not need one: compare an account with itself.
The way out is not a better control. It is a different comparison.
Where this chapter’s code lives
Everything above runs from 04-trying-harder.qmd. Shared setup R/_common.R. The panel itself is built by R/01-build.R.